Having automated tests is a good thing to have to help with your code quality but having those tests without any idea of how much of your code is actually being tested is a really bad thing.
To figure out how much of our code we are actually testing, we need to create a code coverage report. To generate our code coverage report, we going to use the JetBrains dotCover tool.
Note: This post assumes you already have a .NET Core Project that includes unit tests.
Step 1: Install dotCover
First, you need to install dotCover.CommandLineTools package from nuget as a command line tool within the project.
NOTE: We are using the command line version of dotCover as it is free to use and ultimately we will be adding it to our automated builds, so we do not want the GUI version. If you want the GUI version and Visual Studio integration, they do offer a 30 day trial of dotCover.
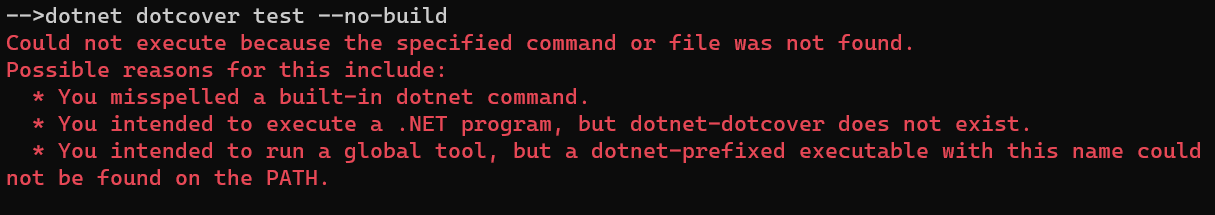
Even though JetBrains says that you can install it from nuget as a package, I have found that if you do that and then try to run dotnet dotcover test you get the following error message.
To fix this error, you need to add dotCover as a DotNetCliToolReference in the unit tests project file by adding the below <ItemGroup>
<ItemGroup>
    <DotNetCliToolReference Include="JetBrains.dotCover.DotNetCliTool" Version="2021.3.3" />
</ItemGroup>
Change the version number above to the latest version available for download at https://www.jetbrains.com/dotCover/download/
Step 2: Restore Number Packages
Now that we have the dotCover cli referenced within the project file as a tool reference, we need to restore the nuget packages by running either dotnet restore or dotnet build
- Open a command line and navigate to your unit test project
- Run
dotnet restore
Step 3: Run Test and Create Test Snapshot
Now we are ready to generate our code coverage report.
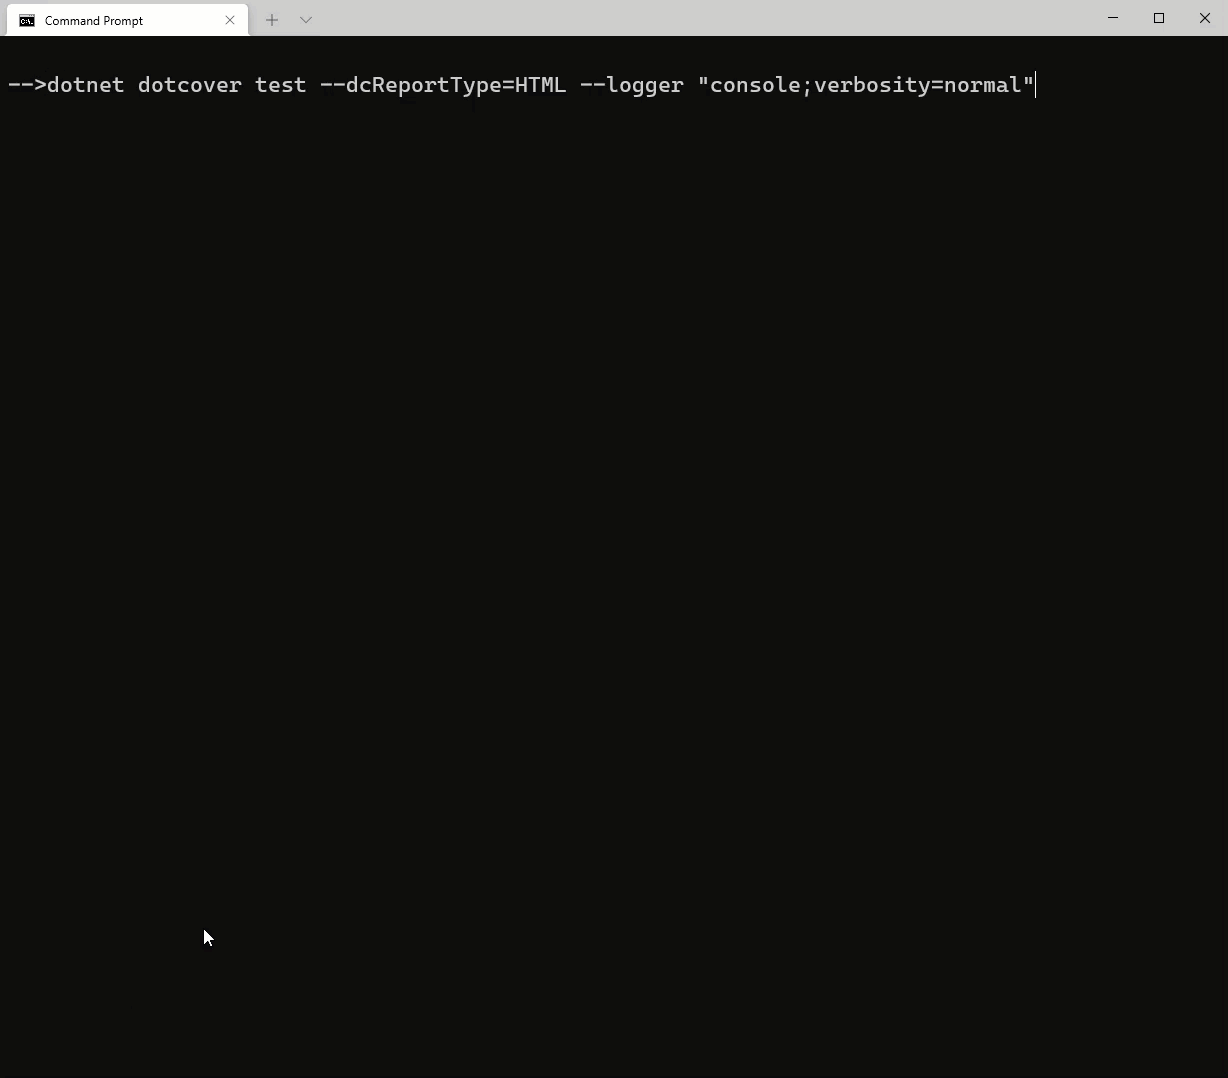
From the same command line you already have open run the following command to execute your tests and generate a code coverage report.
dotnet dotcover test --dcReportType=HTML --logger "console;verbosity=normal"
Step 4: Analyze the Report
The dotCover command we used in step 3 will generate a report in the same directory that we can it in called dotCover.Output.html
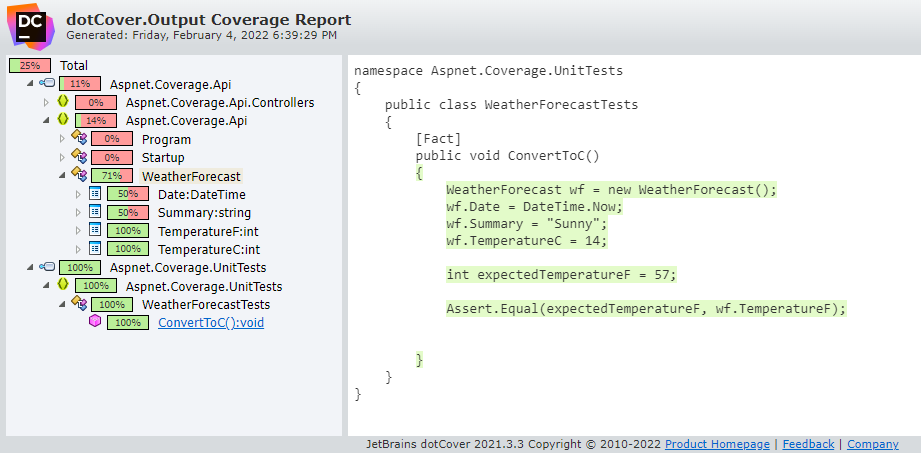
The report will show you which lines of code were covered in your project and you can drill into the source files and see the exact lines that were and were not covered.
Green
text means is was covered and
Red
text means is was NOT covered.
The report will allow you to decide if you need to write additional tests or not and to ensure that the tests is actually covering the code that you think it is covering.
Also, your project team will need to decide on the target code coverage percentage that is your minimum threshold to approve the code to be sent to production.
As a target of 100% code coverage sounds awesome, in a lot of cases this is not a realistic target and the business value to increase the code coverage beyond a certain point does not provide enough additional business value.
In our next post on ASP.NET Code Coverage using dotCover, we will discuss how to filter the report so that it only incudes code that should actually be tested and exclude things like our unit test project, so that our code coverage number is more accurate.
If you want to download the project that I used for this post, you can do so at https://github.com/digitaldrummerj/aspnet-core-code-coverage-example. It is based on .NET 3.1.