Welcome to part two of our two part series on Angular code coverage.
In the previous article, we set up Cypress code coverage for our Angular project so that we could run it locally on our development machine. In this article, we are going to take it to the next step and add it to our automated build.
I am a big believer in DevOps and having automated builds and deployments for all of my projects. In fact, I have had automated builds and deployments since 2002, long before DevOps become a thing.
I will be using TeamCity as the automated build platform and am assuming that you already have your Angular build working and are just adding in code coverage to the build.
This article will be building on the code from the previous article. You can get the code from the previous article at https://github.com/digitaldrummerj/angular-cypress-code-coverage-example
Install Dependencies
On our build server, before running any tests, we need to start up the web server and we need to wait for it to respond before kicking off the. Then when the tests are done running we need to stop the web server so that we do not leave it hanging around on our build server.
Install Web Server Dependency
To enable us to start up and wait for our web server we are going to install 2 dependencies: angular-http-server and start-server-and-test.
angular-http-server allows us to start up the web server in the background so that we can then continue on to run out tests.
start-server-and-test allows us to start up the web server and wait for it to respond before running our Cypress tests.
To install our angular-http-server and start-server-and-test:
Open a command line and navigate to your Angular project
Run the following npm command to install them as devDependencies
npm install --save-dev angular-http-server start-server-and-test
Install Dependency to Enable Serial/Parallel Npm Script Runs
Another really handy npm package for our build scripts is npm-run-all. This package allows us to run npm script commands in serial (1 after the other) or parallel (all at the same time) and works cross platform. For build scripts, I run the commands in serial in order to have a clean and easy to read build log that can be read top to bottom to see what is happening in the build. Even though you get slightly quicker builds with running commands in parallel, the build logs end up just being a mess with all of command logs intermingled and virtual impossible to read to figure out what caused a failed build.
To install npm-run-all:
In the command line that you have opened from the previous dependency install run the following command:
npm install --save-dev npm-run-all
Testing Build Locally
We are now ready to test out our build locally on our development machine. I like to have the ability to run the same build that I would run as part of my automated build locally on my development machine. This also makes it much easier to move to another build provider if needed (yes I have had to do this more than once when a job decide to change their standard platform to use).
Npm Scripts to Add
Open up the package.json file
Add the following scripts to the scripts section of the package.json
"ci:coverage": "run-s build:prod:coverage ci:cypress:coverage",
"build:prod:coverage": "ng build --extra-webpack-config ./cypress/coverage.webpack.js --progress=false",
"ci:cypress:coverage": "start-server-and-test ci:start-server http://localhost:4200 cy:run:coverage",
"ci:start-server": "angular-http-server --path ./dist/CypressCodeCoverageDemo -p 4200 --silent",
"cy:run:coverage": "cypress run --browser chrome --headless  --env coverage=true --config video=false"
Description of the scripts:
- ci:coverage - runs all of the npm scripts to run for the CI process
- build:prod:coverage - builds the application with the –prod flag and with code coverage
- ci:cypress:coverage - start web server, waits for response, then run tests
- ci:start-server - runs web server with the Angular prod build
- ci:run:coverage - runs the Cypress test with a Chrome headless browser with code coverage turns on and video creation turned off (for performance reasons)
Running Build Locally
Now that we have our npm scripts added, we are ready to run our automated build script which is the ci:coverage script
npm run ci:coverage
TeamCity Configuration
The last thing we need to do is setup TeamCity to run our builds, show us the code coverage metrics, be able to view the code coverage report right in TeamCity and add failure metrics for if code coverage percent drops.
Add Code Coverage Metrics to Build
To output the code coverage report and metrics in a format that can be used in TeamCity, we need to add the teamcity reporter to our nyc configuration in the package.json file.
"nyc": {
  "extends": "@istanbuljs/nyc-config-babel",
  "all": true,
  "exclude": [
    "**/cypress/**",
    "**/coverage/**",
    "karma.conf.js",
    "src/test.ts",
    "**/*.spec.ts"
  ],
  "reporter": [
    "html",
    "teamcity"
  ]
}
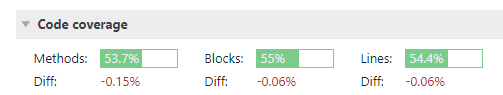
By adding the teamcity report, when we run the tests with code coverage enabled, we will see the code coverage summary when viewing the build results.
View Code Coverage Report
The code coverage summary is great for getting an overall picture of where we are at with out code coverage but it does not allow you to drill into each file to see what was covered or what was not covered. Our build does generate the report but we need to make it visible within TeamCity by adding it as a build report and to the build artifacts.
Adding Build Report
Within TeamCity, you need to edit the build settings to add the build report tab.
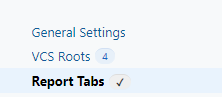
On the left nav bar, click on the Reports Tabs (Note if you don’t see the Reports Tabs, you might need to go higher in the build hierarchy)
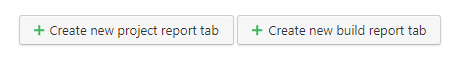
Click on the Create new build report tab
In the dialog that comes up make the title “UI Coverage” and the Start page: “coverage/index.html”
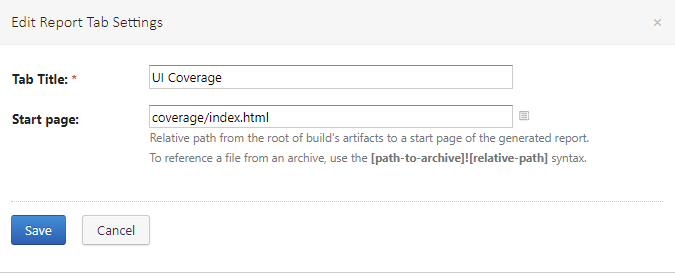
Click the save button
Now if you view a build, you will see a new tab titled “UI Coverage” that will contain the code coverage report that we are going to add to the build artifacts in the next section.

Adding Code Coverage Report as a Build Artifact
Now that we have the build tab setup, we need to add the code coverage report as a build artifact, so that the tab is able to display the code coverage report.
Find your TeamCity build that you want to add the code coverage report to and edit the settings
Under the general tab, you will see the Artifacts paths
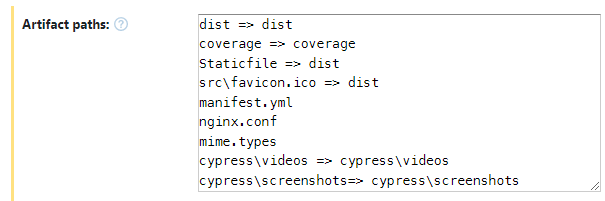
In the artifacts path add the following:
coverage => coverage
cypress\videos => cypress\videos
cypress\screenshots => cypress\screenshots
Click the save button
Add Failure Metrics
The last thing that I like to do with my code coverage builds, is to also add failure metrics to the build so that it fails if the code coverage goes down by X percent, the number of skipped tests increases X percent and the number of overall tests goes down by more than a certain percent. For me, the percentage to use for the failure metrics really depends on the number of tests within the project as the more tests you have the lower you want the percent as you will have more tests in the percentage as the number of tests goes up.
When you are first starting out, I tend to keep it at 5% to 10% and over time I reduce it down to as low as I can go without constantly failing the build. For example, right now we have 800 tests in one of my projects so at 1% that means that we can skip up to 8 tests and remove up to 8 tests. We also have 23,000 lines of code so at 1% it means that we can add up to 230 lines of code that are not called by a test.
Steps to add failure metrics
Note that the failure conditions below use 1% but you can change that to the percent that you want to allow
Find your TeamCity build that you want to add the failure conditions to and edit the settings
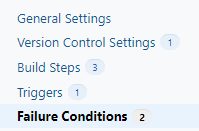
On the left sidebar, click on the Failure Conditions
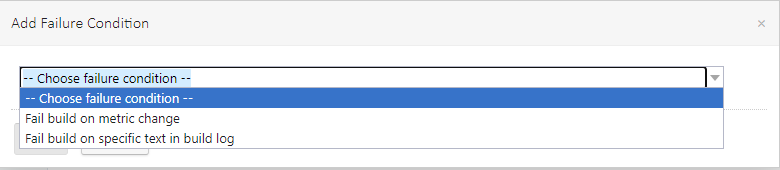
Click on the Add failure condition button and select “Fail build on metric change”
For ignored tests failure: select Fail build if to number of ignored test and set is more by at least 1 percent and click save
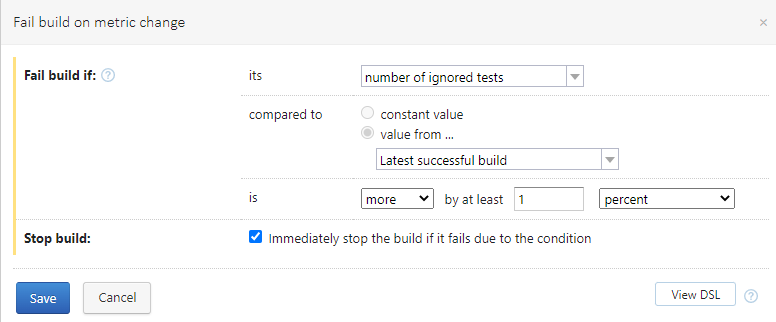
For number of tests failure: select Fail build if to number of tests and set is less by at least 1 percent and click save
For code coverage percent failure: select Fail build if to percentage of statement coverage and set is less by at least 1 percent and click save
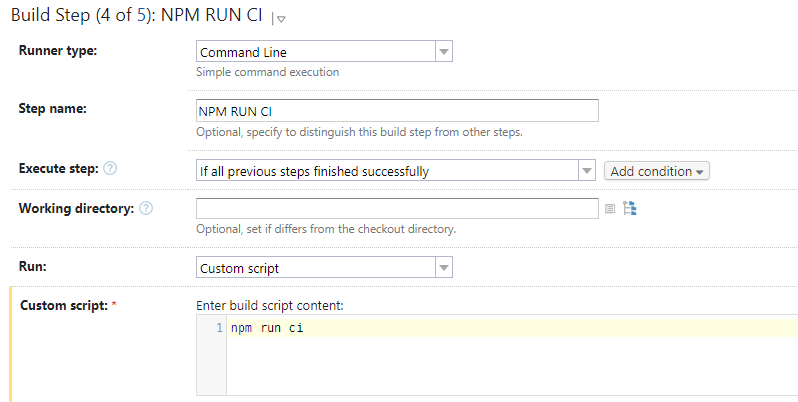
Add Build Step
The last thing we need to do is tell TeamCity to run our cypress tests with code coverage as part of the build.
Since we create the npm script ci earlier, it is really quick to add our build step to TeamCity. We just need to create a build step that runs a command line and calls npm run ci
Warning: if you are planning to take the output of the build step and deploy it to production, you will want to have a production build that does not contain the instrumentation for code coverage as the code coverage will drastically slow down your code as it examines every line of code that is called.