In part 1 and part 2 of of this article series, we setup and optimized our code coverage using the free command line version of dotCover.
In this post, we are going to add our code coverage to our TeamCity builds to run our unit tests with code coverage as part of the automated builds, show us the code coverage metrics summary after the build, be able to view the code coverage report right in TeamCity and add failure metrics for if code coverage percent drops.
In part 1 and 2 of of this article series, we setup and optimized our code coverage using the free command line version of dotCover.
In this post, we are going to add our code coverage to our TeamCity builds to run our unit tests with code coverage as part of the automated builds, show us the code coverage metrics summary after the build, be able to view the code coverage report right in TeamCity and add failure metrics for if code coverage percent drops.
I am a big believer in DevOps and having automated builds and deployments for all of my projects to ensure that the code compiles on a machine other than my development machine, automated tests are executed in a clean environment, and any other work that I need to do to get ready for a deployment is automated. In fact, I have had automated builds and deployments since 2002, long before DevOps become a thing.
I will be using TeamCity as the automated build platform and am assuming that you already have your Angular build working and are just adding in code coverage to the build.
Step 1: Install dotCover Command Line on Build Agent
The first thing that we need to do is install the dotCover command line on our TeamCity build agent. Even though TeamCity has dotCover built-in, unless you are the TeamCity administrator you do not have any ability to update the built-in version of dotCover that TeamCity is using. In my case, we have a team at work that has an on-premise TeamCity instance that they give teams space on but only they have administrative rights to the TeamCity server. We only get to control our build agents.
Luckily, it is really easy to tell TeamCity to use a locally installed dotCover version instead of the built-in TeamCity one.
- Login to Your Build Agent
- Download the dotCover Command Line
- Unzip it to a location on your TeamCity build agent that account that is running the TeamCity build agent service has access to
Step 2: Add Builds Step
We need to add three build steps:
- Run
dotnet restoreto restore our nuget packages - Run our unit tests with code coverage
- Tell TeamCity to process the code coverage results
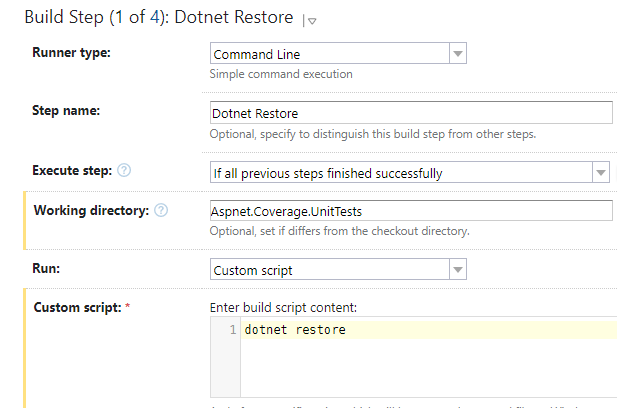
2.1: Restore Nuget Packages
You need to create a build step that is a command line step with the working directory as the Unit Test project folder and the custom script has the command dotnet restore
dotnet restore
Run dotnet restore
2.2: Run Unit Tests with Code Coverage
We need to add a new build step to our TeamCity build and configure it as follows. For the most part we are going to use the command from our previous post with the except of removing the dcReportType parameter so that a snapshot is created instead.
The reason to use a snapshot is so that TeamCity will integrate the code coverage summary and generate the report for us instead of us generating the report outside of TeamCity.
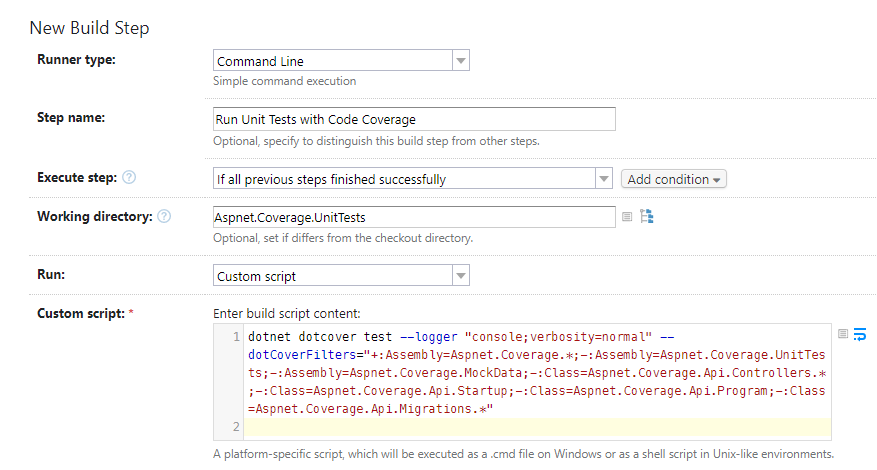
Add a new build step and configure your build step as follows:
Name: Run Unit Tests With Code Coverage
Type: Command Line
Working Directory: Unit Test Project Folder
Run: Custom script
Custom script:
dotnet dotcover test --logger "console;verbosity=normal" --dotCoverFilters="+:Assembly=Aspnet.Coverage.*;-:Assembly=Aspnet.Coverage.UnitTests;-:Assembly=Aspnet.Coverage.MockData;-:Class=Aspnet.Coverage.Api.Controllers.*;-:Class=Aspnet.Coverage.Api.Startup;-:Class=Aspnet.Coverage.Api.Program;-:Class=Aspnet.Coverage.Api.Migrations.*"
Note 1: This command will output a snapshot file named dotCover.Output.dcvr
Note 2: We use the logger with console and verbosity=normal is so that TeamCity can report the status of each individual test.
Run Unit Test Build Step Configuration
2.3: Report Coverage to TeamCity
The next thing we need to do is add a build step to tell TeamCity to process the code coverage snapshot that we generated in the unit tests build step.
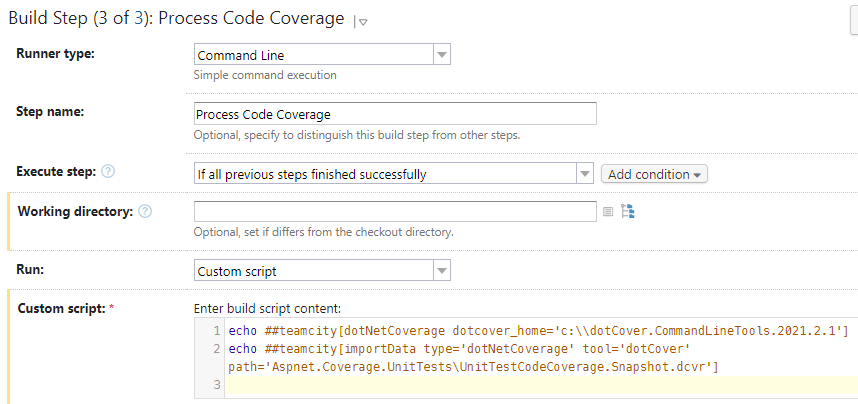
Add a new build step and configure your build step as follows:
Name: Process Code Coverage
Type: Command Line
Run: Custom script
Custom script:
echo ##teamcity[dotNetCoverage dotcover_home='c:\\dotCover.CommandLineTools.2021.3.3']
echo ##teamcity[importData type='dotNetCoverage' tool='dotCover' path='Aspnet.Coverage.UnitTests\UnitTestCodeCoverage.Snapshot.dcvr']
1st line tells TeamCity where to find the local version of dotCover that we can to use. The version number should match the version we setup in our Unit Test project. The dotcover_home should match the location that you unzipped dotcover to.
2nd line tells TeamCity to import the code coverage data and process it
Process Code Coverage Build Step Configuration
Step 3: Add and View Code Coverage Metrics
There is actually nothing more that we need to do in TeamCity for it to show us the code coverage report. We get two reports automatically:
Summary Report on the Build Overview Tab
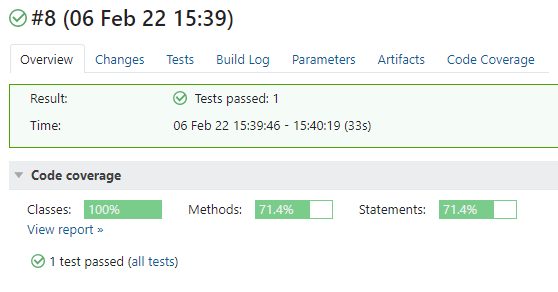
TeamCity Summary Report
Code Coverage Tab to view the code coverage full report. The metric that I look at is
Statements,%as that looks at lines of code covered.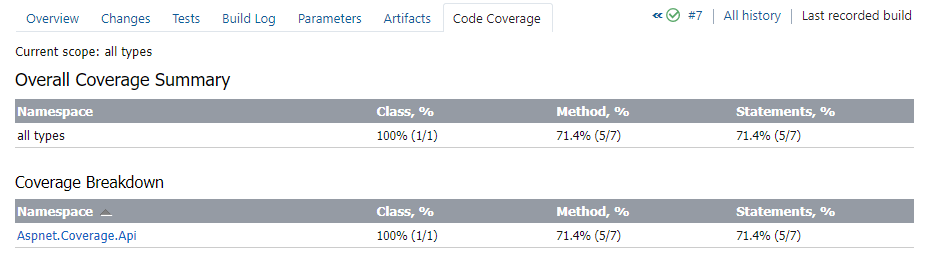
TeamCity Code Coverage Tab
You can also drill all the way down into each file to see which lines of code were covered.
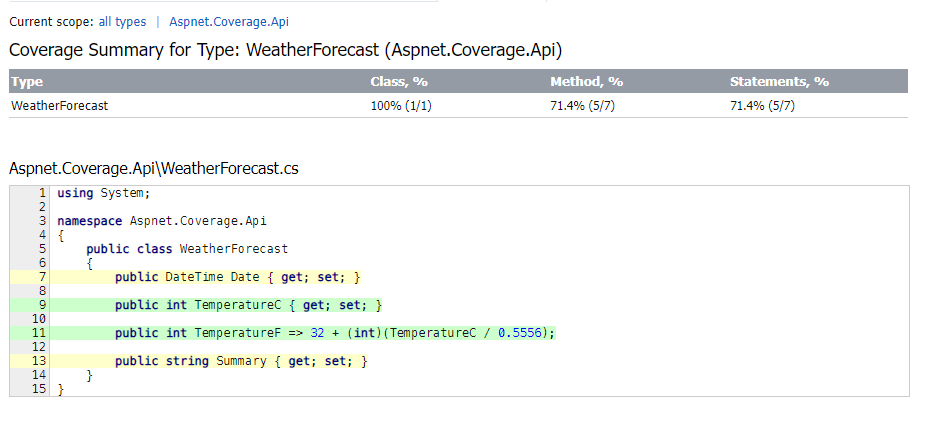
TeamCity Code Coverage Report Code File
Step 4: Add Failure Metrics
The last thing that I like to do with my code coverage builds, is to also add failure metrics to the build so that it fails if the code coverage goes down by X percent, the number of skipped tests increases X percent and the number of overall tests goes down by more than a certain percent. For me, the percentage to use for the failure metrics really depends on the number of tests within the project as the more tests you have the lower you want the percent as you will have more tests in the percentage as the number of tests goes up.
When you are first starting out, I tend to keep it at 5% to 10% and over time I reduce it down to as low as I can go without constantly failing the build. For example, right now we have 800 tests in one of my projects so at 1% that means that we can skip up to 8 tests and remove up to 8 tests. We also have 23,000 lines of code so at 1% it means that we can add up to 230 lines of code that are not called by a test.
Note that the failure conditions below use 1% but you can change that to the percent that you want to allow
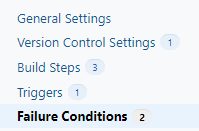
Find your TeamCity build that you want to add the failure conditions to and edit the settings
On the left sidebar, click on the Failure Conditions
Click on the Add failure condition button and select “Fail build on metric change”
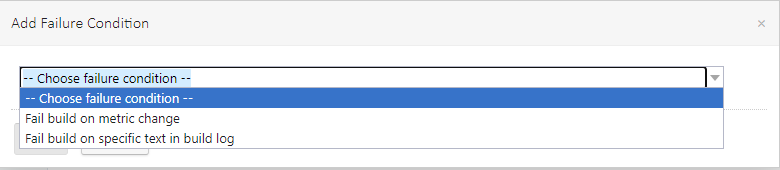
For ignored tests failure: select Fail build if to number of ignored test and set is more by at least 1 percent and click save
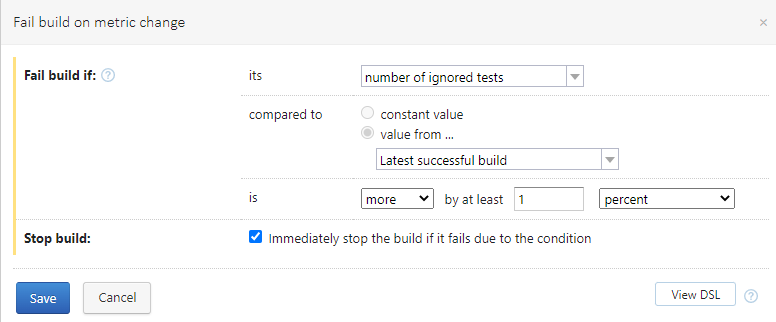
For number of tests failure: select Fail build if to number of tests and set is less by at least 1 percent and click save
For code coverage percent failure: select Fail build if to percentage of statement coverage and set is less by at least 1 percent and click save
If you want to download the project that I used for this post, you can do so at https://github.com/digitaldrummerj/aspnet-core-code-coverage-example. It is based on .NET 3.1.